
CREATING CLARITY FROM COMPLEXITY
Artificial intelligence and exponential technologies speaker
Trusted by


Featured in


Keynote Speaking & Events
Generative AI: the good, the bad, the revolutionary
The Past and Future of the Exponential Age
Expert Interviews
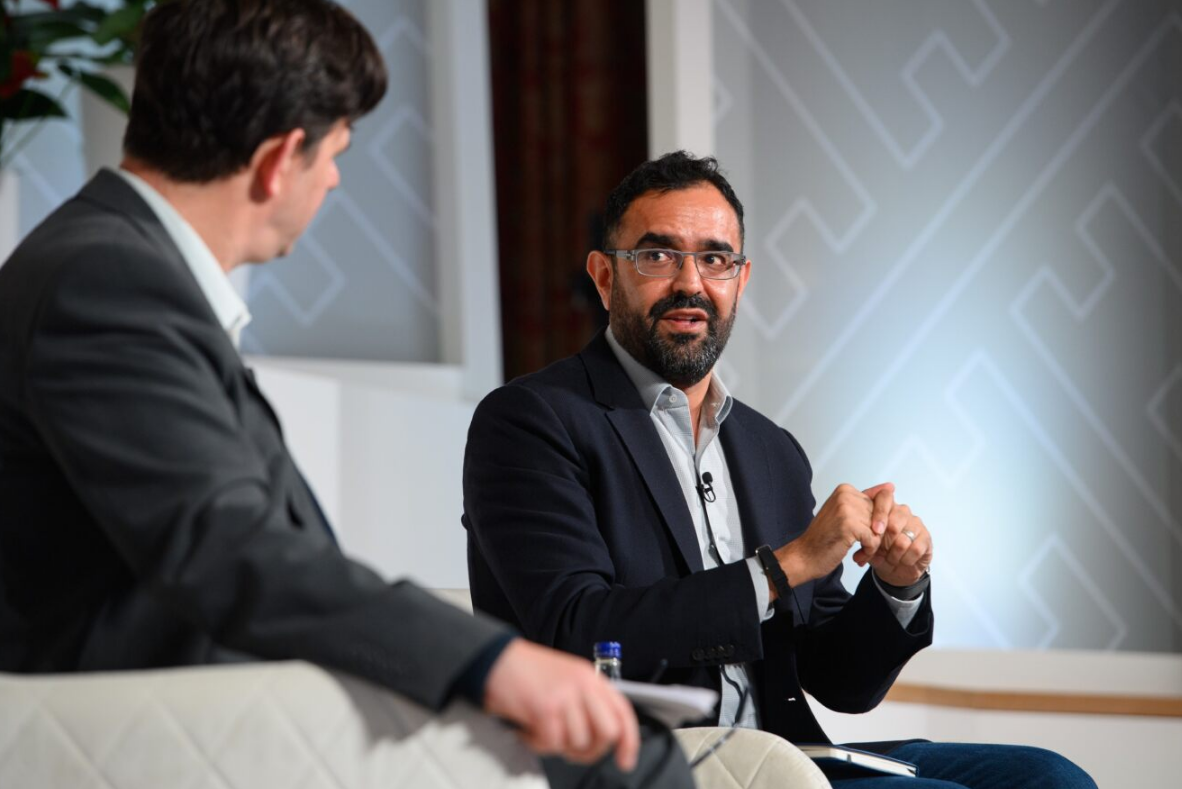
Founder of Exponential View, Bestselling Author and Keynote Speaker
I am dedicated to demystifying the prospects and possibilities of the future. We find ourselves at a pivotal moment in history, as we navigate significant shifts driven by a range of powerful exponential technologies.
I aim to bring the themes of this exponential transition to life in a manner that is expert, accessible, and systematic. My goal is to shed light on the complexities of these changes, assisting individuals and organizations in understanding the evolving landscape, anticipating how the world might change, and preparing for these shifts.
TRUSTED BY


-
![]()
“Azeem Azhar is one of the best-regarded thought leaders in the industry. But more importantly, he has a broad understanding of the exponential ways technology can be used to solve our biggest problems, shape our society, and bridge cultural divides.”
– Daniel Ek, Founder and CEO, Spotify
-
![]()
“Azeem is a master at interpreting a dazzling array of trends and illuminating the future."
– Paul Daugherty, CTO Accenture